Interactive Knowledge Graph of Blog Posts Using Vis-Network JS
Building a Network Visualization from an XML Sitemap
Part of the Knowledge Graphs series
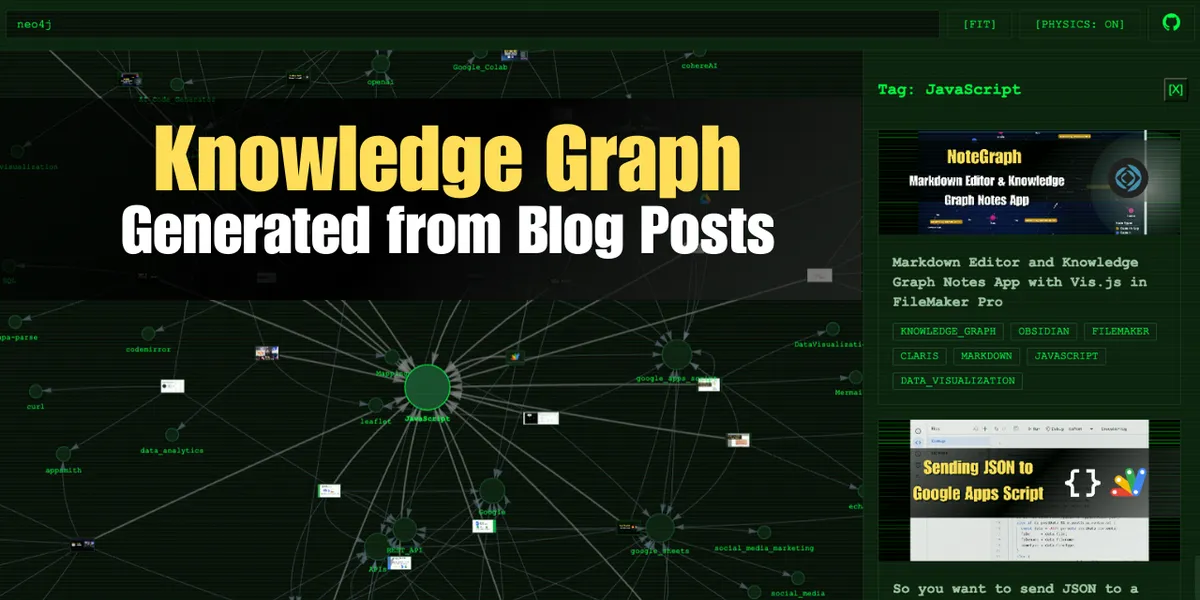
Knowledge graphs are widely used by enterprises to discover patterns in their data, detect fraud, monitor supply chains, power recommendation engines, and other industry-specific use cases. But they can also be great visualization tools for personal use, enabling you to discover patterns in your own data and explore it in a visual format.
In this guide, I’ll show you how to build an interactive knowledge graph using the Vis-network JavaScript library, and data from an API response. Here’s a live demo of the finished product, using data from my own blog’s RSS feed.
https://greenflux-graph.vercel.app/
This guide will cover:
- Basic Vis-network usage and data format
- Graph Physics and other options
- Fetching XML data from a sitemap
- Converting XML to JSON
- Transforming JSON to Vis-network nodes/edge format
- Displaying live data as a knowledge graph
- Adding click events
Basic Vis-network usage and data format
Like most data visualization libraries, Vis-network works by selecting a target element to display the data, then running a function and passing in a config object. From the Vis-network docs:
    // create an array with nodes
    var nodes = new vis.DataSet([
        {id: 1, label: 'Node 1'},
        {id: 2, label: 'Node 2'},
        {id: 3, label: 'Node 3'},
        {id: 4, label: 'Node 4'},
        {id: 5, label: 'Node 5'}
    ]);

    // create an array with edges
    var edges = new vis.DataSet([
        {from: 1, to: 3},
        {from: 1, to: 2},
        {from: 2, to: 4},
        {from: 2, to: 5}
    ]);

    // create a network
    var container = document.getElementById('mynetwork');

    // provide the data in the vis format
    var data = {
        nodes: nodes,
        edges: edges
    };
    var options = {};

    // initialize your network!
    var network = new vis.Network(container, data, options);
Here’s a live example with a little styling. Try dragging a node or scrolling to zoom!
Graph Physics and other options
You can control the physics, theme, interactions, and settings in the options object that is supplied as the 3rd argument when initializing the network. With interactions, you can set hover effects and actions for click events, control drag and zoom, and other user interactions.
Here’s an example with tooltips and click events.
Fetching XML Data and Converting to JSON
Next, we’ll pull data from an API and transform it to work with vis-network. For this example, I’ll be using fetch to pull the sitemap from by blog’s RSS feed, as an XML file. This will require an extra step of converting the XML to JSON before formatting the data again, to work with Vis-network.
First, import the script:
<script src='https://cdn.jsdelivr.net/npm/[email protected]/lib/fxp.min.js'></script>Then fetch the XML and parse it.
document.addEventListener('DOMContentLoaded', async () => {

    const xml = await fetch('https://blog.greenflux.us/feed.xml');
    const txt = await xml.text();
    const parser = new fxp.XMLParser();
    const json = parser.parse(txt);
    console.log(json)
}
Transforming JSON to Vis-network nodes/edge format
From here, you can transform the JSON into nodes and edges to display in vis-network:
const posts = json.rss.channel.item;
const nodes = [];
const edges = [];
const uniqueTags = new Set();

posts.forEach((post, index) => {
	const postId = 'post-' + post.link.split('/').filter(Boolean).pop();
	nodes.push({
		id: postId,
		label: post.title,
		group: 'post',
		title: post.title,
		value: 1
	});

	const categories = Array.isArray(post.category) ? post.category : [post.category];
	categories.forEach(tag => {
		if (tag) {
			const tagId = 'tag-' + tag.toLowerCase().replace(/[^a-z0-9]/g, '_');
			const tagLabel = '#' + tag.toLowerCase().replace(/_/g, '');

			if (!uniqueTags.has(tagId)) {
				uniqueTags.add(tagId);
				nodes.push({
					id: tagId,
					label: tagLabel,
					group: 'tag',
					title: `Tag: ${tagLabel}`,
					value: 1
				});
			} else {
				const existingNode = nodes.find(n => n.id === tagId);
				if (existingNode) {
					existingNode.value += 1;
				}
			}
			edges.push({ from: postId, to: tagId });
		}
	});
});

const nodesData = new vis.DataSet(nodes);
const edgesData = new vis.DataSet(edges);
This creates a nodes array (blog posts) and an edges array (post-to-tag relationship). Then you just need to build the option object based on your data:
const options = {
    physics: {
        enabled: true,
        solver: 'barnesHut',
        barnesHut: {
            gravitationalConstant: -2000,
            centralGravity: 0.1,
            springLength: 120,
            springConstant: 0.04
        },
        stabilization: { iterations: 100 }
    },
    nodes: {
        // Default node font (used as a fallback)
        font: {
            color: '#00ff41',
            size: 14,
            face: 'Inconsolata, Consolas, monospace',
            multi: false
        },
        shadow: true,
        scaling: { min: 10, max: 20 },
        color: {
            border: '#334155',
            background: '#0f172a',
            highlight: { border: '#39b54a', background: '#132a19' },
            hover: { border: '#39b54a', background: '#0f172a' }
        }
    },
    edges: {
        width: 1,
        color: { color: '#94a3b8' },
        smooth: { type: 'dynamic' }
    },
    groups: {
        post: {
            shape: 'box', // Enables rectangular node with wrapping
            font: {
                color: '#00ff41',
                size: 14,
                face: 'Inconsolata, Consolas, monospace'
            },
            color: {
                border: '#39b54a', // Bright green border
                background: '#0f172a', // Dark background
                highlight: { border: '#7bff8c', background: '#132a19' },
                hover: { border: '#7bff8c', background: '#0f172a' }
            },
            borderWidth: 2,
            borderRadius: 5,
            widthConstraint: {
                minimum: 180,
                maximum: 250  // Enforces text wrapping at 250px width
            },
            margin: { top: 10, right: 10, bottom: 10, left: 10 } // Padding
        },
        tag: {
            shape: 'dot',
            font: {
                color: '#00ff41',
                face: 'Inconsolata, Consolas, monospace'
            },
            color: {
                border: '#1a4d2e',
                background: '#0f1f12'
            },
            scaling: { min: 14, max: 28 }
        }
    },
    interaction: {
        hover: true,
        tooltipDelay: 0
    }
};
Displaying live data as a knowledge graph
Lastly, the graph can be initialized by selecting an element from the DOM and creating a new network, passing in the container element, data, and options.
const container = document.getElementById('graph-container');
const data = {
	nodes: nodesData,
	edges: edgesData
};
const network = new vis.Network(container, data, options);
Adding Click Events
To make it interactive, we can add click events on the nodes and edges. In this case, I’ll open the blog post when clicking on a post node and open the /tags/TAGNAME page of my blog when a tag is clicked.
network.on('click', (params) => {
	if (params.nodes.length > 0) {
		const nodeId = params.nodes[0];
		const node = nodesData.get(nodeId);

		if (node.group === 'post') {
			const postData = posts.find(p => nodeId === 'post-' + p.link.split('/').filter(Boolean).pop());
			if (postData && postData.link) {
				window.open(postData.link, '_blank');
			} else {
				alert(`Clicked post: ${node.label}`);
			}
		} else {
			const tagName = node.label.substring(1);
			const tagUrl = `https://blog.greenflux.us/tags/${tagName}`;
			window.open(tagUrl, '_blank');            }
	}
});
Putting it all together, we can fetch the data on page load, transform it, and render a knowledge graph from live API data!
This provides a unique and interesting way to explore any website, and can easily be applied to other data structures like social network contacts, school or work notes, or any other dataset you want to visualize.
Conclusion
Vis-network is a powerful open-source JavaScript library for displaying knowledge graphs. With a little data transformation, you can visualize any related dataset as an interactive network, and build data-driven, dynamic web apps with advanced node interactions. These knowledge graphs are commonly used by large enterprises on large datasets, but they can also be useful interactive visualizations for personal projects like blogs or journals.