Migrating Excel Logic to the Web with HyperFormula
Moving spreadsheet formulas to custom web apps
Part of the Google Apps Script series

It’s 2026, AI can write any software you can imagine, and yet many critical business operations are still trapped in Excel and Google Sheets. Why? It’s not hard to create a table or data grid, and there are tons of libraries for it. But users love spreadsheets, not for the grid, but for the other features, like copy/pasting ranges, undo/redo, inserting/deleting rows, column filters/sorting, and a powerful formula syntax. Those are complex features to replicate. And even if you rebuild all the UI features, translating the formula logic and dependancies to your own code would be a challenge even for AI.
HyperFormula was built to solve this exact problem. You feed it the range of data, with actual Google Sheets or Excel formulas as strings, and it returns the exact same calculated values. Your business logic doesn’t have to be trapped in brittle spreadsheets that break every time someone adds a row! HyperFormula can run headless (server-side) or in the browser. So you can use it on the backend as a calculation engine, or pair it with Handsontable or any data grid library to build interactive spreadsheets in your own app.
In this guide, I’ll show you how to migrate a spreadsheet with multiple related formulas and formatting, to a React app using Handsontable and HyperFormula.
This guide will cover:
- Creating a new React app locally with Vite
- Importing Handsontable and displaying a data grid
- Using HyperFormula to add calculated columns to the grid
- Copying formula logic from an existing sheet
- Replicating cell formatting from the existing sheet
- Applying themes and using the theme builder
Let’s get this sheet started! 🚀
Prerequisites
- Node.js (v18+)
- npm or yarn
Set up new React project
Open a terminal and cd to wherever you want to create the project.
Then, run:
# Scaffold the project
npm create vite@latest my-invoice-app -- --template react

# Move into the project directory
cd my-invoice-app

# Install Handsontable and HyperFormula
npm install handsontable @handsontable/react-wrapper hyperformula

# Start the dev server
npm run dev
Open http://localhost:5173/ and verify the server is running.

Set up Handsontable
Next, replace the App.jsx contents with this example from the Handsontable React quick start guide:
import './App.css'
import Handsontable from 'handsontable/base';
import { HotTable } from '@handsontable/react-wrapper';
import { registerAllModules } from 'handsontable/registry';
registerAllModules();
function App() {
return (
<HotTable
data={[
['', 'Tesla', 'Volvo', 'Toyota', 'Ford'],
['2019', 10, 11, 12, 13],
['2020', 20, 11, 14, 13],
['2021', 30, 15, 12, 13]
]}
rowHeaders={true}
colHeaders={true}
height="auto"
autoWrapRow={true}
autoWrapCol={true}
licenseKey="non-commercial-and-evaluation" // for non-commercial use only
/>
)
}
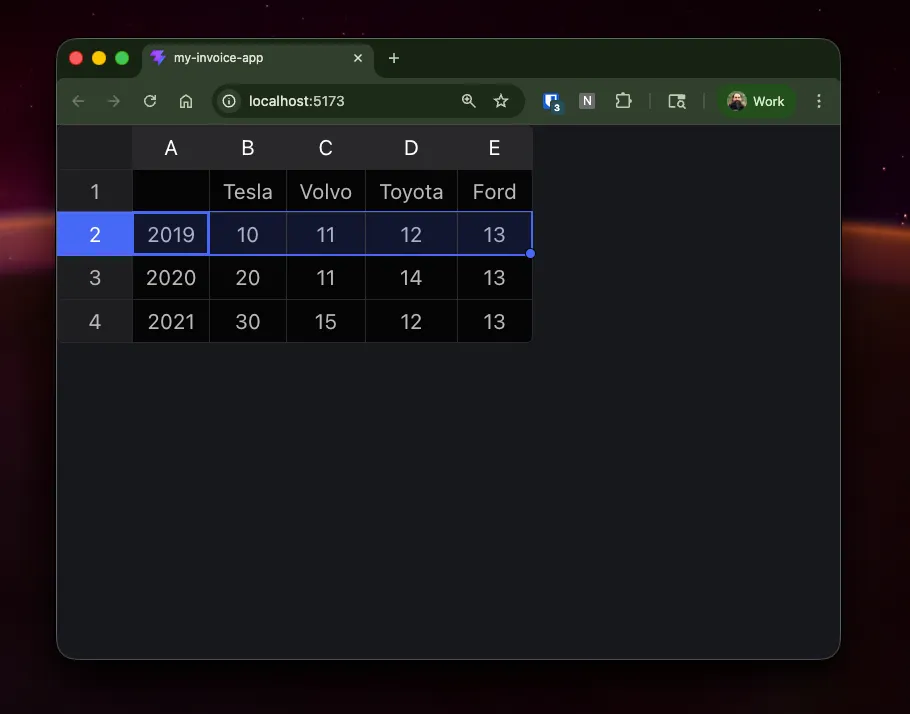
export default AppSave the file and the page should update automatically, showing a spreadsheet with a number of vehicles sold per year.
Set up HyperFormula
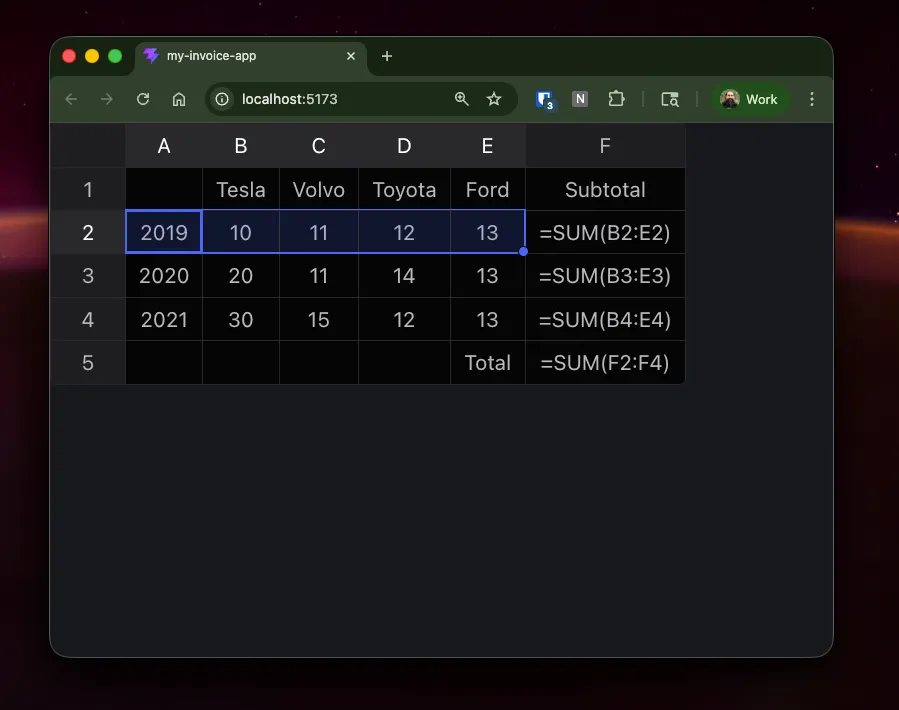
Next we can add a new column F to show the Subtotal for each row, and a new row at the bottom to show the Total of the Subtotals.
Update the data array with the new formulas as strings, just like you would in Google Sheets or Excel.
[
    ['', 'Tesla', 'Volvo', 'Toyota', 'Ford', 'Subtotal'],
    ['2019', 10, 11, 12, 13, '=SUM(B2:E2)'],
    ['2020', 20, 11, 14, 13, '=SUM(B3:E3)'],
    ['2021', 30, 15, 12, 13, '=SUM(B4:E4)'],
    ['', '', '', 'Total',    '=SUM(F2:F4)']
  ]
Save, and you should see the new row and column.
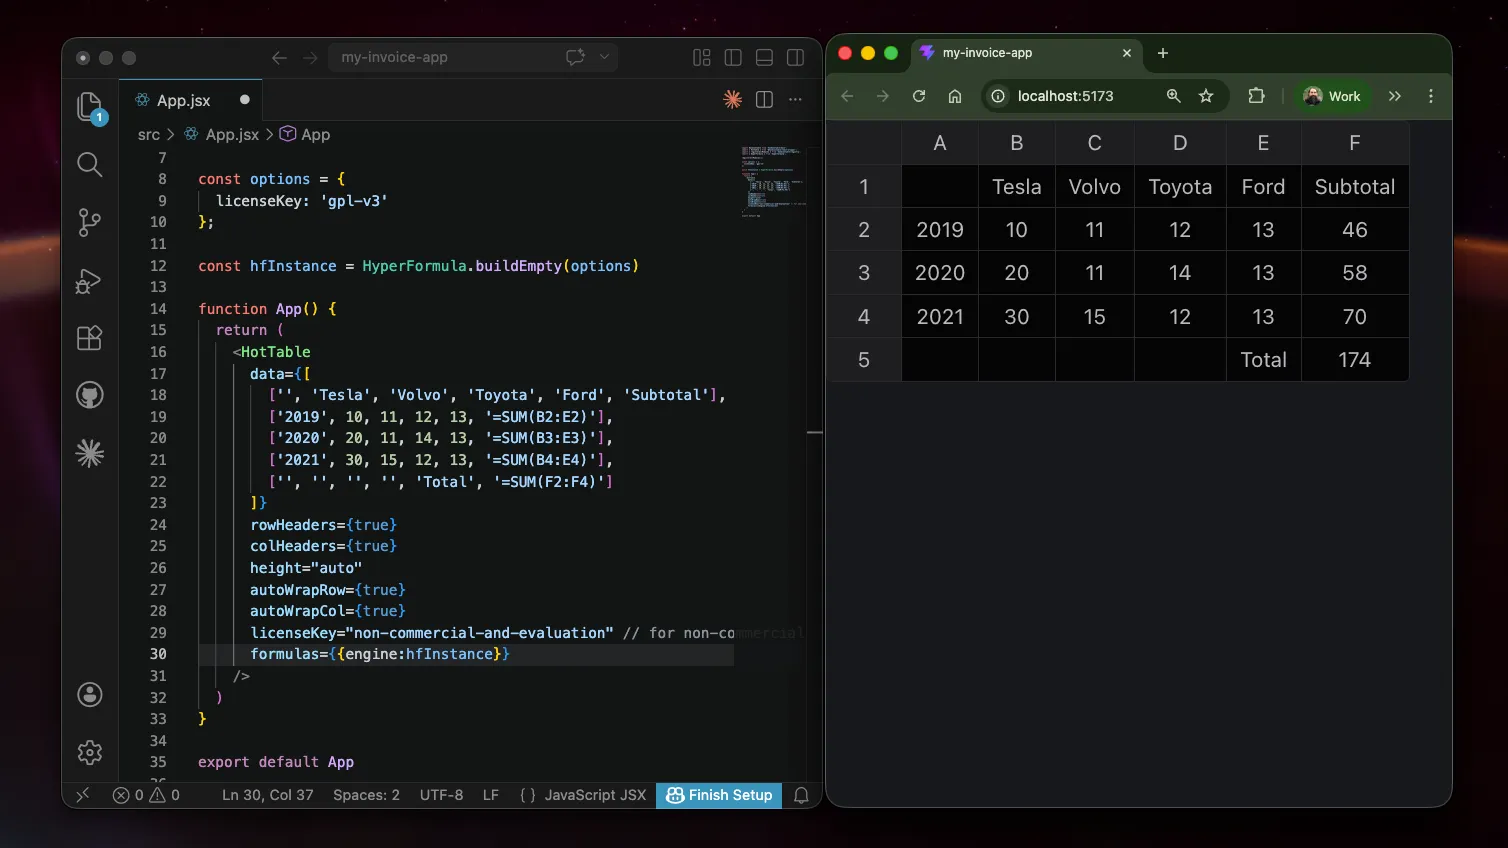
Lastly, create a new instance of HyperFormula and add it to the HotTable component.
Update the App function with:
const options = {
  licenseKey: 'gpl-v3'
};

const hfInstance = HyperFormula.buildEmpty(options)

function App() {
  return (
    <HotTable
      data={[
        ['', 'Tesla', 'Volvo', 'Toyota', 'Ford', 'Subtotal'],
        ['2019', 10, 11, 12, 13, '=SUM(B2:E2)'],
        ['2020', 20, 11, 14, 13, '=SUM(B3:E3)'],
        ['2021', 30, 15, 12, 13, '=SUM(B4:E4)'],
        ['', '', '', '', 'Total', '=SUM(F2:F4)']
      ]}
      rowHeaders={true}
      colHeaders={true}
      height="auto"
      autoWrapRow={true}
      autoWrapCol={true}
      licenseKey="non-commercial-and-evaluation" // for non-commercial use only
      formulas={{engine:hfInstance}}
    />
  )
}
Note the formulas={{engine:hfInstance}} added to the end of the HotTable properties.
Save, and now the formula strings will display as the calculated values!

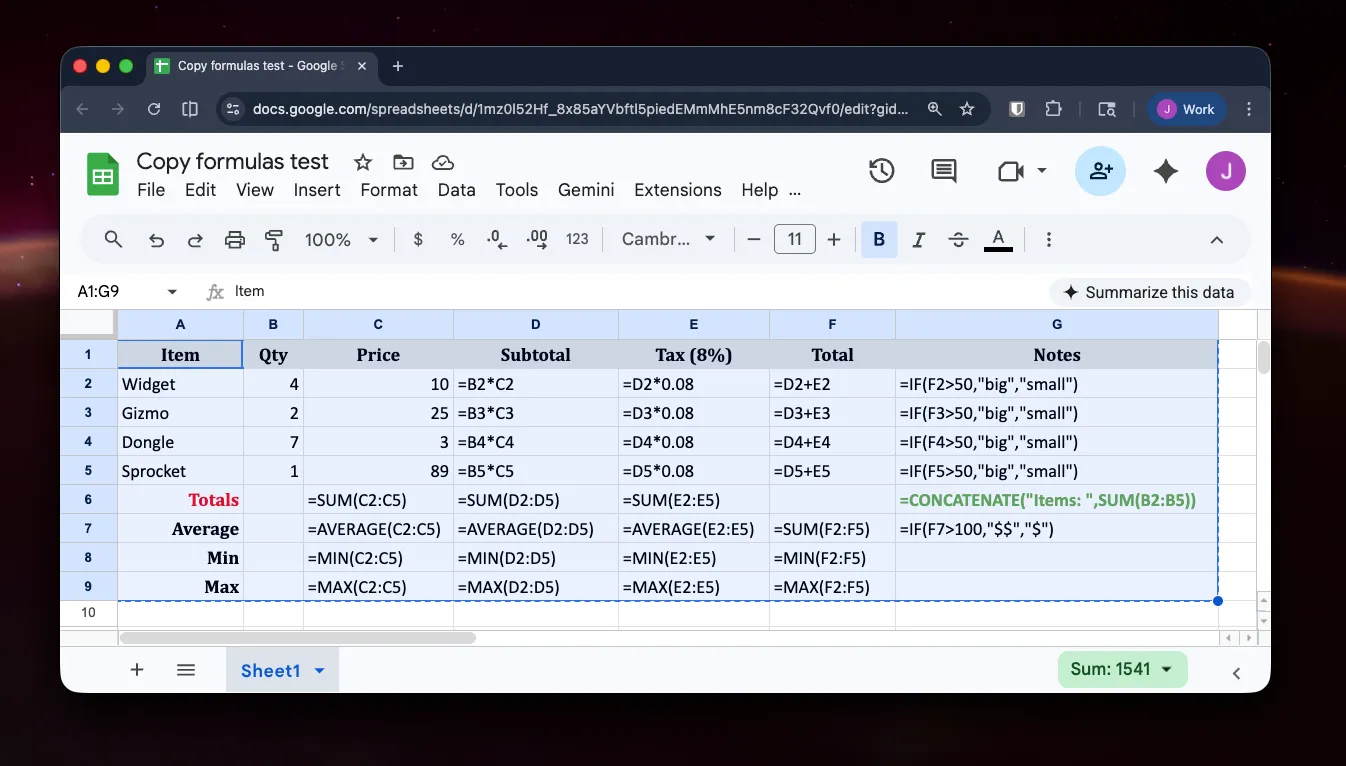
Migrating formulas from a spreadsheet
It’s actually really easy to copy formulas and migrate the logic to your web app! Just enable the Show Formulas option in the View menu to see all the formula strings at once.
Unfortunately, if you try to copy/paste the whole range from sheets to the jsx file, it won’t be in the right format. It needs to be a proper array, with quotes around all the strings, commas between values, and encased in square brackets.
But you can still copy from Excel/GSheets and paste it in ChatGPT, then ask it to format it for you! Just paste in the range from the spreadsheet with this prompt:
Turn this into a proper 2D array with quotes on the strings, commas and square brackets. THEN, you can paste that 2D array into the App() function’s data property.
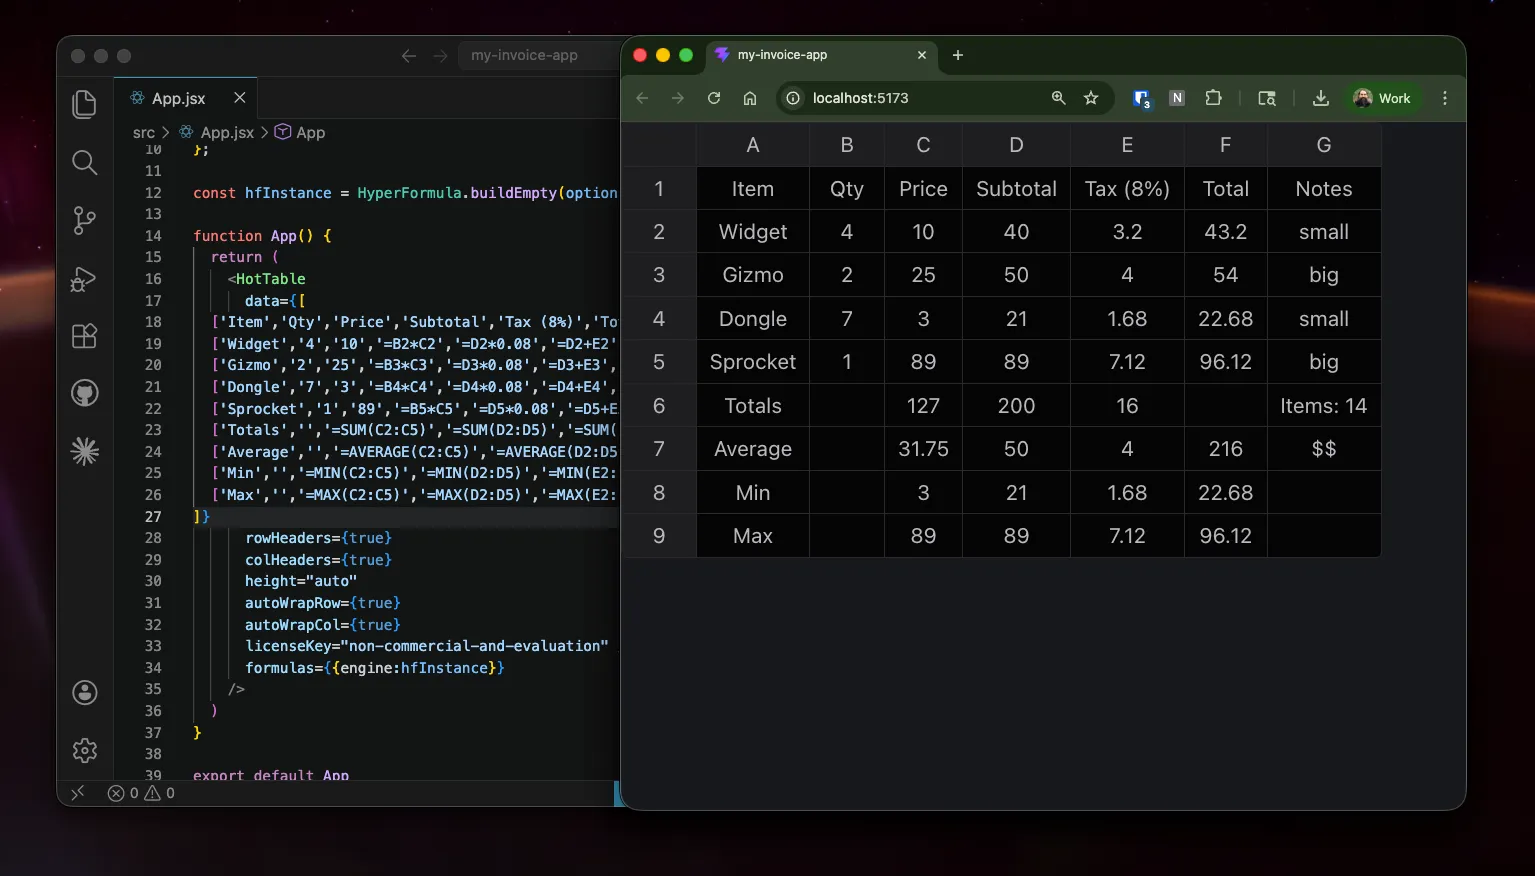

Copying sheet formatting
Ok, looking back at the original spreadsheet, we have some colors to apply, columns that should be right-aligned, and currency formatting to apply. All of these are simple config options.
Just add a hotConfig object, with colWidths, columns (format whole column), and cell (individual cell formatting)- all arrays. Then add the object to the HotTable component:
const hotConfig = {
  colWidths: [120, 70, 100, 100, 100, 100, 120],

  columns: [
    { type: 'text' },
    { type: 'numeric', numericFormat: { pattern: '0,0' }, className: 'htRight' },
    { type: 'numeric', numericFormat: { pattern: '$0,0.00', culture: 'en-US' }, className: 'htRight' },
    { type: 'numeric', numericFormat: { pattern: '$0,0.00', culture: 'en-US' }, className: 'htRight' },
    { type: 'numeric', numericFormat: { pattern: '$0,0.00', culture: 'en-US' }, className: 'htRight' },
    { type: 'numeric', numericFormat: { pattern: '$0,0.00', culture: 'en-US' }, className: 'htRight' },
    { type: 'text', className: 'htRight' },
  ],

  cell: [
    { row: 0, col: 0, className: 'header-cell htCenter' },
    { row: 0, col: 1, className: 'header-cell htCenter' },
    { row: 0, col: 2, className: 'header-cell htCenter' },
    { row: 0, col: 3, className: 'header-cell htCenter' },
    { row: 0, col: 4, className: 'header-cell htCenter' },
    { row: 0, col: 5, className: 'header-cell htCenter' },
    { row: 0, col: 6, className: 'header-cell htCenter' },

    { row: 5, col: 0, className: 'total-label htRight' },
    { row: 6, col: 0, className: 'summary-label htRight' },
    { row: 7, col: 0, className: 'summary-label htRight' },
    { row: 8, col: 0, className: 'summary-label htRight' },

    { row: 5, col: 6, className: 'green-text htRight' },
    { row: 6, col: 6, className: 'bold-text htRight' },
  ],
};

function App() {
  return (
    <HotTable
      data={[
        ['Item', 'Qty', 'Price', 'Subtotal', 'Tax (8%)', 'Total', 'Notes'],
        ['Widget', '4', '10', '=B2*C2', '=D2*0.08', '=D2+E2', '=IF(F2>50,"big","small")'],
        ['Gizmo', '2', '25', '=B3*C3', '=D3*0.08', '=D3+E3', '=IF(F3>50,"big","small")'],
        ['Dongle', '7', '3', '=B4*C4', '=D4*0.08', '=D4+E4', '=IF(F4>50,"big","small")'],
        ['Sprocket', '1', '89', '=B5*C5', '=D5*0.08', '=D5+E5', '=IF(F5>50,"big","small")'],
        ['Totals', '', '=SUM(C2:C5)', '=SUM(D2:D5)', '=SUM(E2:E5)', '', '=CONCATENATE("Items: ",SUM(B2:B5))'],
        ['Average', '', '=AVERAGE(C2:C5)', '=AVERAGE(D2:D5)', '=AVERAGE(E2:E5)', '=SUM(F2:F5)', '=IF(F7>100,"$$","$")'],
        ['Min', '', '=MIN(C2:C5)', '=MIN(D2:D5)', '=MIN(E2:E5)', '=MIN(F2:F5)', ''],
        ['Max', '', '=MAX(C2:C5)', '=MAX(D2:D5)', '=MAX(E2:E5)', '=MAX(F2:F5)', ''],
      ]}
      rowHeaders={true}
      colHeaders={true}
      height="auto"
      autoWrapRow={true}
      autoWrapCol={true}
      licenseKey="non-commercial-and-evaluation"
      formulas={{ engine: hfInstance }}
      {...hotConfig}
    />
  );
}
Note the
{...hotConfig}added to the end of theHotTableproperties.
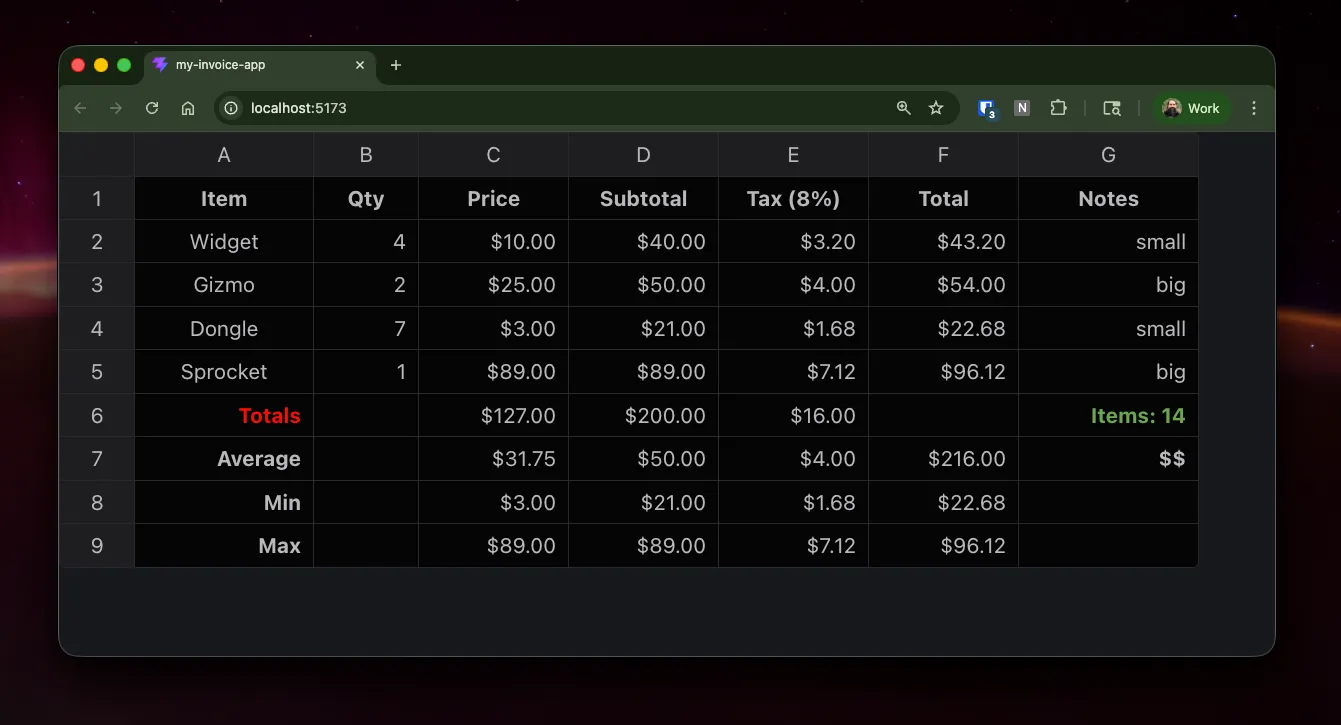
Next, replace the App.css with a few styles to match the class names:
td.header-cell { background: #d9d9d9; }
td.total-label { color: #ff0000; }
td.green-text { color: #6aa84f; }
td.header-cell, td.summary-label, td.total-label, td.green-text, td.bold-text {
font-weight: 700;
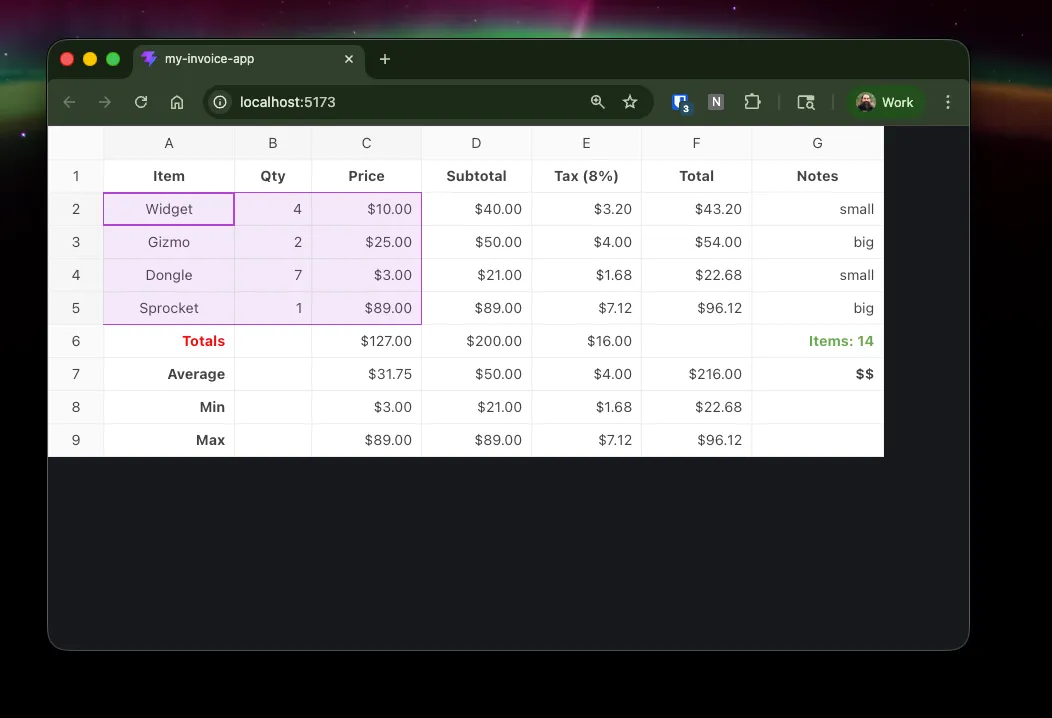
}Save, and you should now see the colors, currency formatting, and text alignment update.
Try typing in any of the data cells and the calculated values update!

You can even use ctrl (or cmd)-z/y for undo/redo, paste in a range of values, drag a value to auto-fill cells below, and all the other rich interactions that Excel and Google Sheets users have come to expect! And if you want to enable sorting, insert/delete rows, or any other feature, it’s just a config setting away, without writing any complex code from scratch.
When building with AI coding tools, this approach has a MASSIVE reduction in token consumption and hallucination risk, because the AI only has to write a few config options, instead of tons of new code for each feature.
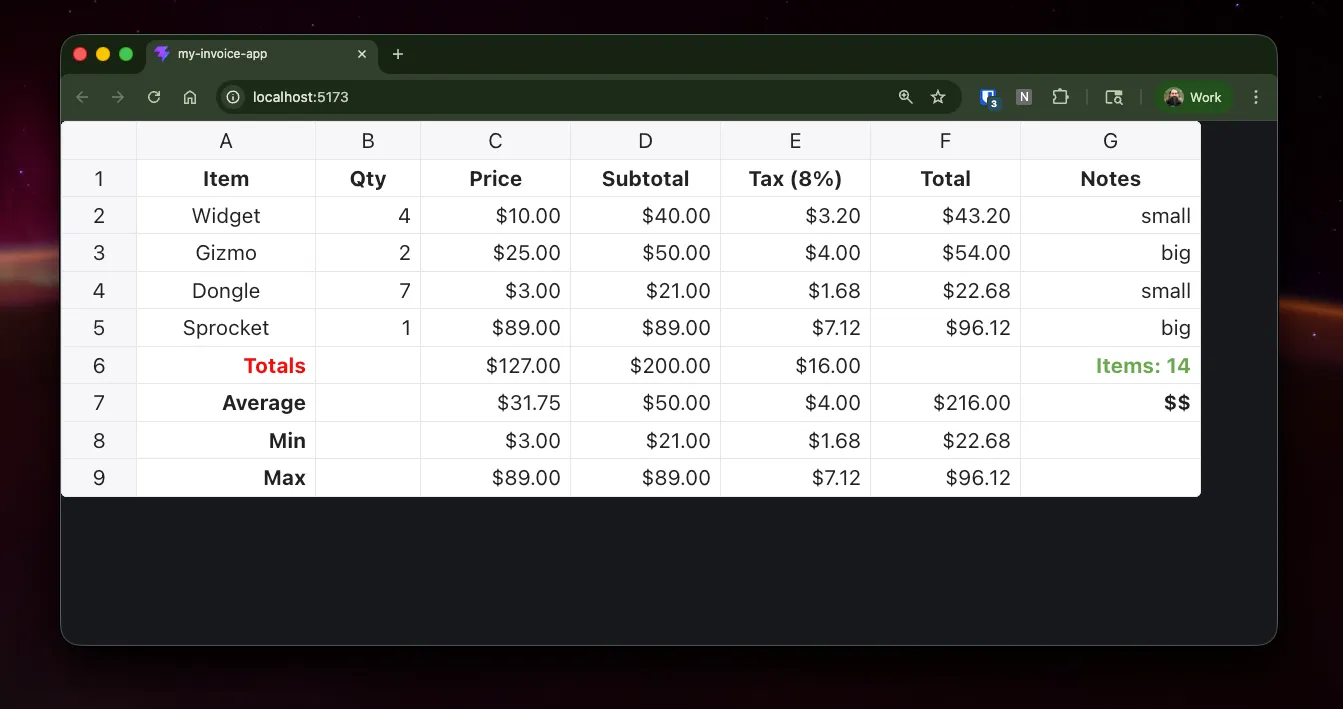
Applying Themes
We’ve seen how to format columns and cells, but what about theming the entire table?
First, import the theme you want, and the registerTheme module.
import { mainTheme, registerTheme } from 'handsontable/themes';Then register your theme:
const theme = registerTheme(mainTheme)
  .setColorScheme('light')   // 'light', 'dark', or 'auto'
  .setDensityType('compact');  // 'default', 'compact', or 'comfortable'
And finally, set the theme in the HotTable properties:
theme={theme}Save, and you should notice the theme change, but you’ll also see the custom CSS we added is now being over-ridden. This is because the theme’s specificity is higher than the bare class selectors in our App.css.
To fix it, just prepend the css rules with .ht-theme-{theme.name}:
.ht-theme-main .header-cell { font-weight: bold; background: #f0f0f0; }
.ht-theme-main .total-label { font-weight: bold; }
.ht-theme-main .summary-label { font-style: italic; }
.ht-theme-main .green-text { color: green; }
.ht-theme-main .bold-text { font-weight: bold; }Note:
registerTheme()has two different signatures.
// Signature 1: theme object with name inside
registerTheme(mainTheme)          // mainTheme.name === 'main'
// Signature 2: explicit name + config
registerTheme('custom-theme', {}) // name is the first arg
docs/javascript-data-grid/themes/
That’s it! It only takes a few lines of actual code, outside of the config objects and raw data.
Theme Builder
Alright, we’ve covered the basics and how you can migrate a data grid with calculated columns to a web app. But it probably looks nothing like the rest of your app. To match your app’s styling, you can either customize one of the default themes at the row/column/cell level, or design your own theme using the theme builder.
Try out the theme builder and create a new custom theme. Then copy the config into your own app! https://handsontable.com/theme-builder
Drill down to a few specific config settings, and customize one of the colors, font-weights, or other properties.
Once you have the theme customized,
- Click Generate Code
- Select React
- Select the App.jsx tab
Then copy the imports and theme config.
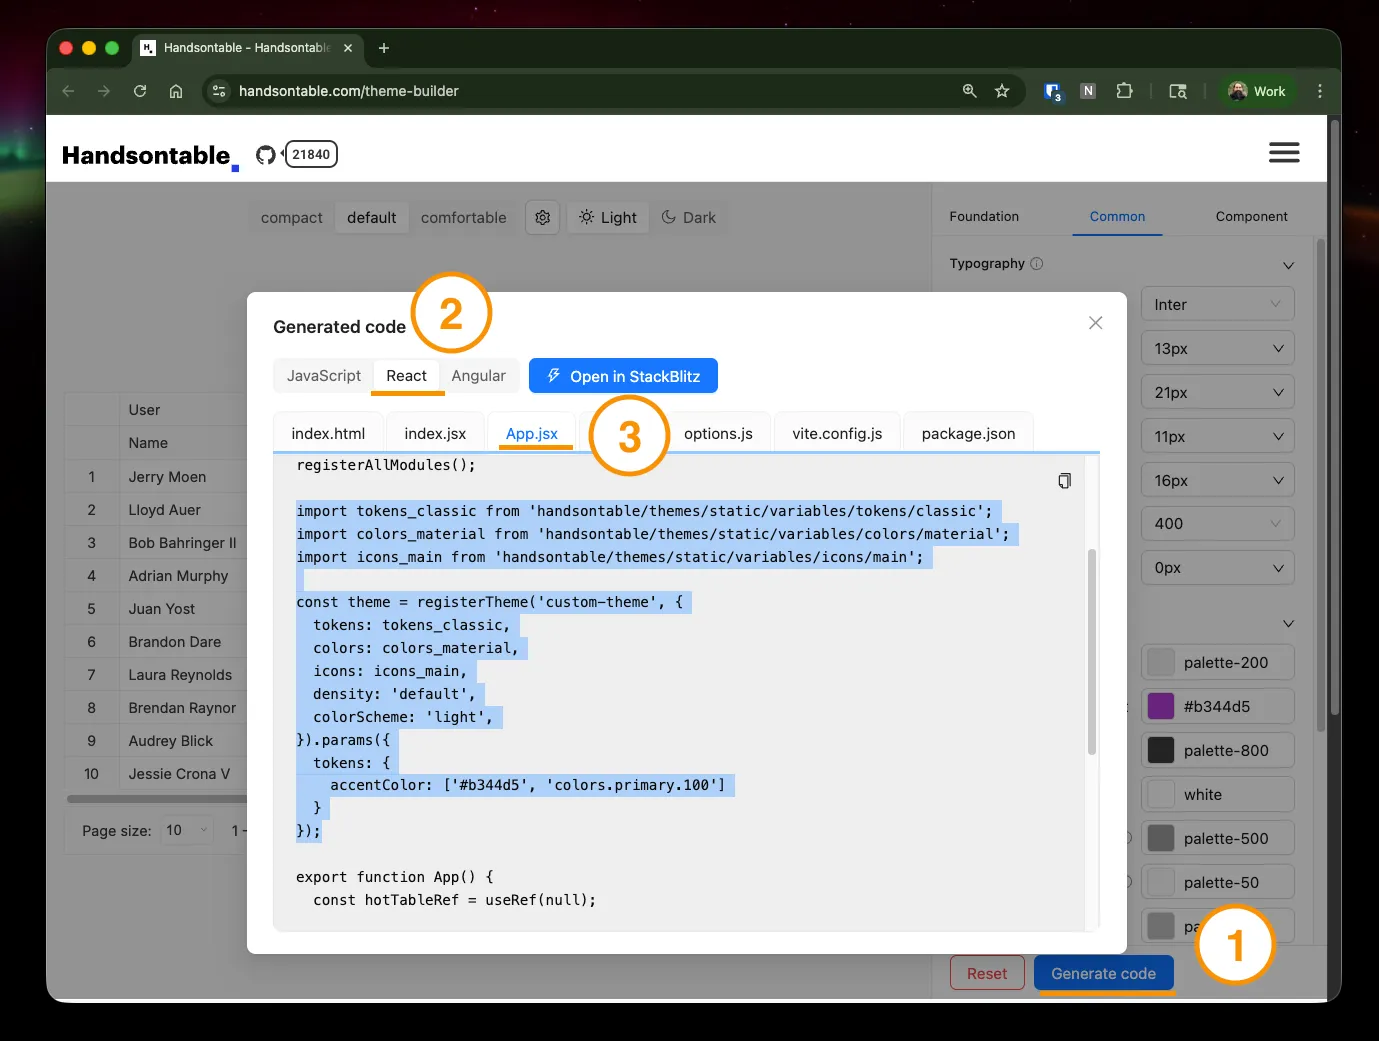
Paste it into your App.jsx, overwriting the old theme declaration. Again you’ll notice that the new theme is applied, but the previous App.css customizations are lost. Just update the ht-theme-main classes to ht-theme-custom-theme, to match the new theme name.
You can also use Handsontable with your own design system, and generate themes that match your existing application. docs/javascript-data-grid/handsontable-design-system/
This gives you plenty of options to style your table, and we haven’t even talked about custom renderers yet! But I’ll save that one for the next post.
Conclusion
Business logic doesn’t have to be trapped in Excel and Google Sheets. HyperFormula and Handsontable create an easy migration path that keeps existing formulas intact and continues to provide the same rich interactions that spreadsheet users love.
If you enjoyed this article, sign up at news.greenflux.us! I’m considering writing a Part 2 that shows how to integrate a backend database or API for a full CRUD app. Sign in to comment on this post and let me know what you’d like to see in part 2.