Generating Heatmaps in Google Sheets using Apps Script and ECharts
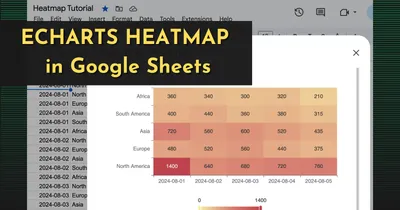
Interactive Heatmap in under 100 lines of code!
Heatmaps are a great way to visualize aggregate data so you can easily see trends and spikes in the data. They can summarize data across a range of time, display traffic and weather patterns, or any o...