


Markdown Editor and Knowledge Graph Notes App with Vis.js in FileMaker Pro
A Star Trek Themed Editor Inspired by Obsidian


Markdown is used widely in programming, documentation, content creation, GitHub, and lots of other areas in tech. One of the most popular Markdown editors is Obsidian, a note taking app with an interesting graph view that shows how all of your notes are connected.
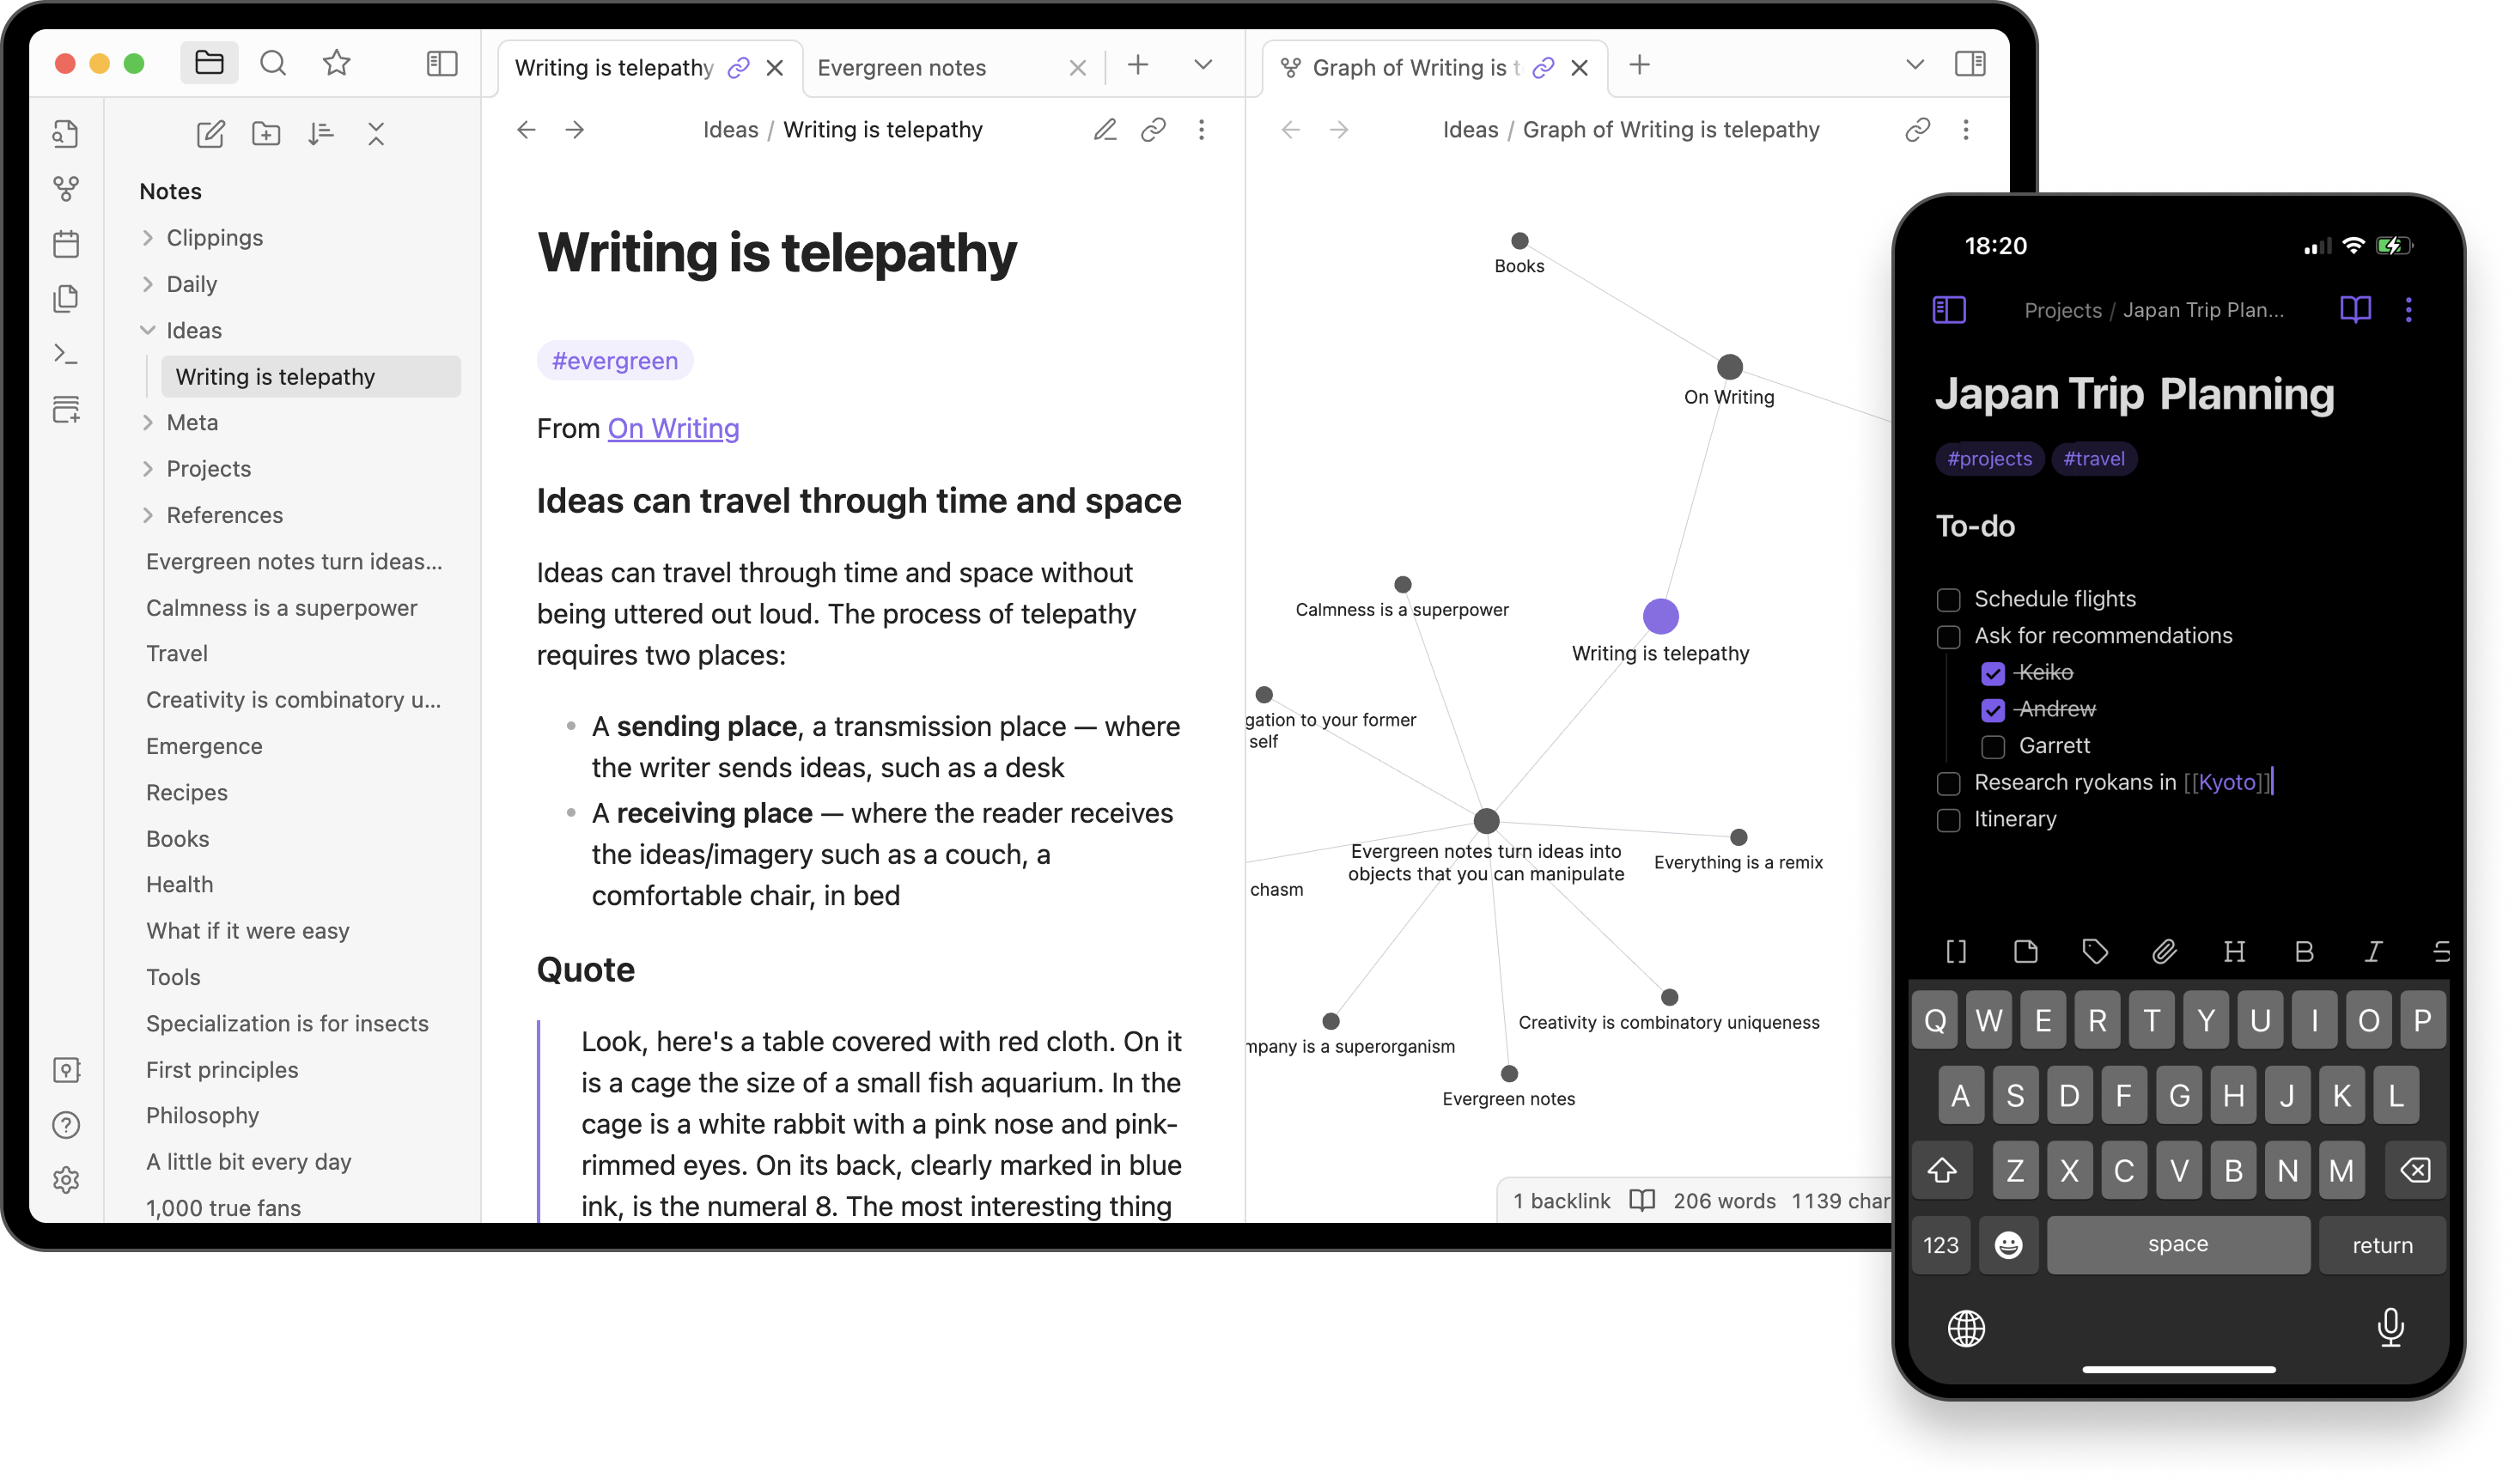
The graph view is interactive and allows you to navigate through notes and see how they are connected to other records.
In this guide, I’ll show how to build a Markdown editor in FileMaker Pro, and generate an interactive network graph of the notes to explore your data.
This guide will cover:
Building a Markdown Editor in a Web Viewer with Marked.js
Adding support for syntax highlighting code blocks with Prism.js
Building JSON to feed the graph view
Building the graph view with Vis.js
Here’s a quick preview of the finished app


At first I was just going to build a basic Markdown editor and I needed some mock data. I had ChatGPT generate some Captain’s Log entries from Star Trek, and then I got a bit carried away and decided to recreate the LCARS display! 🖖
Then I thought the network graph from Obsidian could work well with it, and look kind of like a system of planets. This was a bit more than I originally planned on doing for this Markdown editor tutorial, but it sounded like a fun challenge. Now that I have it working, I wanted to share a guide on how to build your own.
Ready to dive in? Let’s get started!
(Wanna skip the tutorial, and just copy the finished app? 👉 GitHub Repo)
Building a Markdown Editor with Marked.js
Building a Markdown editor from scratch may sound complex, but the Marked.js library makes it quite easy to set up. Just import the library and select an element, then set the innerHTML to marked.parse(), passing in your Markdown text.

Marked.js displays the compiled Markdown, given an input of raw Markdown text. To build an editor, you need an input or text area to feed it.

First let’s set up a basic web viewer in FileMaker with Marked.js. There are lots of ways to provide the HTML to the web viewer, like entering it directly in the web viewer source field, storing it in a text field, or using a text layout object. I prefer to use the layout object method, as it avoids the issues with quotes when entering directly in the web viewer source, and avoids creating new fields.
Paste the following code into a new text object, off to the side of the layout where it won’t appear on the screen. Name the object webviewerCode so we can reference it in the next step.
<!DOCTYPE html>
<html lang="en">
<head>
  <meta charset="UTF-8" />
  <meta name="viewport" content="width=device-width, initial-scale=1.0" />
  <title>Marked.js Live Preview</title>
  <script src="https://cdn.jsdelivr.net/npm/marked/marked.min.js"></script>
  <style>
    body { font-family: sans-serif; display: flex; gap: 2rem; padding: 1rem; }
    textarea { width: 45%; height: 90vh; font-family: monospace; }
    #preview { width: 45%; height: 90vh; overflow-y: auto; border: 1px solid #ccc; padding: 1rem; }
  </style>
</head>
<body>
  <textarea id="input"># Sample Markdown

- **Bold item**
- _Italic item_
- [Link](https://example.com)

</textarea>

  <div id="preview"></div>

  <script>
    const input = document.getElementById('input')
    const preview = document.getElementById('preview')

    const renderMarkdown = () => {
      preview.innerHTML = marked.parse(input.value)
    }

    input.addEventListener('input', renderMarkdown)
    renderMarkdown() // Initial render
  </script>
</body>
</html>
Then add a web viewer and set the source to:
GetLayoutObjectAttribute ( "webviewerCode"; "content" )
You should now see a text area for the input and a live preview of the Markdown.

Preloading the Editor Content from FMP Records
Next we want to populate the editor from field data in FileMaker. In my case I’m using a notes table with a body field. Update the webviewerCode text object to insert a placeholder that can be used to insert the body.
<textarea id="input">{MARKDOWN_TEXT}</textarea>
Then update the web viewer source to insert the body field.
Substitute (

  GetLayoutObjectAttribute ( "webviewerCode"; "content" );  // source text
  "{MARKDOWN_TEXT}";  //  search value
  notes::body         //  replace value

 )
You should now be able to view Markdown from the notes::body field. You can also edit the Markdown and see it update in real-time on the preview pane. But there’s no way to save it yet!

Saving the Markdown
Next, add a Save button to the HTML in the webviewerCode object, and set it to run a FileMaker script called Save Note, which we’ll create in the next step.
   <button onclick="saveMarkdown()">Save</button>

  <script>
    const input = document.getElementById('input')
    const preview = document.getElementById('preview')

    const renderMarkdown = () => {
      preview.innerHTML = marked.parse(input.value)
    }

    const saveMarkdown = () => {
      FileMaker.PerformScript("Save Note", input.value)
    }

    input.addEventListener('input', renderMarkdown)
    renderMarkdown() // Initial render
  </script>
Then create the Save Note script in FileMaker Pro.
Set Variable [ $markdown; Value:Get(ScriptParameter) ]
Set Field [ notes::body; $markdown ]
Return to Browse Mode and test it out! You should now be able to save the note.

Adding syntax highlighting with Prism.js
Next we’ll add Prism.js for syntax highlighting of code blocks. Import the library and use the Prism.highlightAll() method to automatically detect and highlight all code blocks on the page. Here’s an updated version of the complete HTML so far:
<!DOCTYPE html>
<html lang="en">
<head>
  <meta charset="UTF-8" />
  <meta name="viewport" content="width=device-width, initial-scale=1.0" />
  <title>Marked.js Live Preview</title>

  <script src="https://cdn.jsdelivr.net/npm/marked/marked.min.js"></script>
  <script src="https://cdn.jsdelivr.net/npm/prismjs@1.29.0/prism.min.js"></script>
  <link rel="stylesheet" href="https://cdn.jsdelivr.net/npm/prismjs@1.29.0/themes/prism.css" />

  <style>
    body { font-family: sans-serif; display: flex; gap: 2rem; padding: 1rem; }
    textarea { width: 45%; height: 90vh; font-family: monospace; }
    #preview { width: 45%; height: 90vh; overflow-y: auto; border: 1px solid #ccc; padding: 1rem; }
    pre { background: #f5f5f5; padding: 10px; overflow-x: auto; }
    code { font-family: monospace; }
  </style>
</head>
<body>
  <textarea id="input">{MARKDOWN_TEXT}</textarea>

  <div id="preview"></div>

  <button onclick="saveMarkdown()">Save</button>

  <script>
    const input = document.getElementById('input')
    const preview = document.getElementById('preview')

    const renderMarkdown = () => {
      preview.innerHTML = marked.parse(input.value)
      Prism.highlightAll()
    }

    const saveMarkdown = () => {
      FileMaker.PerformScript("Save Note", input.value)
    }

    input.addEventListener('input', renderMarkdown)
    renderMarkdown()
  </script>
</body>
</html>
Now enter some Markdown with a code block. Include the language to ensure the correct formatting is applied.

Ok, you can preload the editor, save the current value, and display syntax highlighting. The basics are working. From here you can use your framework and libraries of choice style the UI.
Here’s a more complete version using Vue3, with separate modes for Full Editor, Full Preview, and Split Screen.
<!DOCTYPE html><html lang="en"><head>
  <meta charset="UTF-8" />
  <meta name="viewport" content="width=device-width, initial-scale=1.0" />
  <title>Markdown Editor</title>
  <!-- Vue & Marked -->
  <script src="https://cdn.jsdelivr.net/npm/vue@3.2.37/dist/vue.global.prod.js"></script>
  <script src="https://cdn.jsdelivr.net/npm/marked@4.0.16/lib/marked.esm.js" type="module"></script>
  <!-- Prism.js (Dark Theme) -->
  <script src="https://cdn.jsdelivr.net/npm/prismjs@1.29.0/prism.min.js"></script>
  <link rel="stylesheet" href="https://cdn.jsdelivr.net/npm/prismjs@1.29.0/themes/prism-tomorrow.css">
  <style>
    body {
      font-family: Arial, sans-serif;
      margin: 0;
      padding: 0;
      background-color: #000;
    }
    *, *::before, *::after {
      box-sizing: border-box;
    }
    .toolbar {
      display: flex;
      justify-content: center;
      background-color: #222;
      padding: 10px;
      gap: 10px;
    }
    .toolbar button {
      color: #000;
      border: none;
      padding: 10px;
      font-weight: bold;
      cursor: pointer;
    }
    .toolbar button:nth-child(1) { background: #9944ff; }
    .toolbar button:nth-child(2) { background: #dd4445; }
    .toolbar button:nth-child(3) { background: #7687fe; }
    .toolbar button:nth-child(4) { background: #ff7706; }
    .editor-container {
      display: flex;
      width: 100%;
      height: calc(100vh - 50px);
    }
    .editor-pane, .preview-pane {
      flex: 1;
      padding: 20px;
      overflow-y: auto;
      background-color: #121212;
    }
    /* Preserve Prism token colors */
    .preview-pane :not(pre):not(code) {
      color: #f0f0f0;
    }
    .editor-pane {
      border-right: 1px solid #333;
    }
    textarea {
      width: 100%;
      height: 100%;
      font-size: 1rem;
      padding: 10px;
      background: #1e1e1e;
      color: #fff;
      border: none;
      resize: none;
    }
    pre {
      background: #1e1e1e;
      padding: 10px;
      overflow-x: auto;
    }
    .preview-pane ul,
    .preview-pane ol {
      margin: 1em 0;
      padding-left: 40px;
    }
    .preview-pane ul {
      list-style-type: disc;
    }
    .preview-pane ol {
      list-style-type: decimal;
    }
    .editor-container.editor .preview-pane {
      display: none;
    }
    .editor-container.preview .editor-pane {
      display: none;
    }
    .editor-container.split .editor-pane,
    .editor-container.split .preview-pane {
      flex: 1;
    }
  </style>
</head>
<body>
  <div id="app">
    <div class="toolbar">
      <button @click="toggleView('editor')">Full Editor</button>
      <button @click="toggleView('preview')">Full Preview</button>
      <button @click="toggleView('split')">Split Screen</button>
      <button @click="saveMarkdown">Save</button>
    </div>
    <div class="editor-container" :class="viewMode">
      <div v-if="viewMode !== 'preview'" class="editor-pane">
        <textarea v-model="markdown" @input="renderMarkdown"></textarea>
      </div>
      <div v-if="viewMode !== 'editor'" class="preview-pane" v-html="compiledMarkdown"></div>
    </div>
  </div>
  <script type="module">
    import { marked } from 'https://cdn.jsdelivr.net/npm/marked@4.0.16/lib/marked.esm.js';
    import { createApp, ref, watch } from 'https://cdn.jsdelivr.net/npm/vue@3.2.37/dist/vue.esm-browser.prod.js';

    const app = createApp({
      setup() {
        const initialMarkdown = document.getElementById('initial-markdown-content').textContent;
        const markdown = ref(initialMarkdown);
        const compiledMarkdown = ref('');
        const viewMode = ref('split');

        const renderMarkdown = () => {
          compiledMarkdown.value = marked(markdown.value, {
            breaks: true,
            gfm: true
          });
          setTimeout(() => {
            Prism.highlightAll();
          }, 0);
        };

        const toggleView = (mode) => {
          viewMode.value = mode;
          // Re-apply syntax highlighting when view mode changes
          setTimeout(() => {
            Prism.highlightAll();
          }, 10);
        };

        const saveMarkdown = () => {
          FileMaker.PerformScript("Save Note", markdown.value);
        };

        watch(markdown, renderMarkdown, { immediate: true });

        // Also watch viewMode changes to reapply highlighting
        watch(viewMode, () => {
          setTimeout(() => {
            Prism.highlightAll();
          }, 10);
        });

        return {
          markdown,
          compiledMarkdown,
          viewMode,
          toggleView,
          saveMarkdown,
          renderMarkdown
        };
      }
    });

    document.addEventListener('DOMContentLoaded', () => {
      app.mount('#app');
    });
  </script>
  <!-- Hidden element with markdown content -->
  <div id="initial-markdown-content" style="display: none;">{MARKDOWN_TEXT}</div>
</body>
</html>

Ok, on to the graph view!
Building JSON for the graph view
With the Markdown editor, we created an HTML doc and merged in the Markdown text using a placeholder and the Substitute() function. For the graph view, we’ll use the same approach, but we need to merge in JSON data to feed the graph. If your file is hosted on FileMaker server, I highly recommend using the FileMaker Data API to fetch your records as JSON. This is much easier than using a script or calculation, and it’s more efficient because the server handles the load and it does it in a single request, instead of looping through records.
However, in my case, I’m building this file locally and I wanted others to be able to test it without hosting the file. So we’re gonna do it the hard way with a script.
Create a new script called Build JSON. Then use a While() loop and ExecuteSQL() to convert your notes into a JSON array.
Set Variable [ $$noteJson;
  Value: While (
    [
      ~delim = "|" ;
      ~sql = "SELECT \"id\", \"title\", \"tags\", \"project\", \"created_by\" FROM \"notes\"" ;
      ~result = ExecuteSQL ( ~sql ; ~delim; ¶ ) ;
      ~rowCount = ValueCount ( ~result ) ;
      ~i = 0 ;
      ~output = JSONSetElement ( "" ; "" ; "[]" ; JSONString )
    ] ;

    ~i < ~rowCount ;

    [
      ~row = GetValue ( ~result ; ~i + 1 ) ;
      ~fields = Substitute ( ~row ; ~delim ; "¶" ) ;
      ~id = GetValue ( ~fields ; 1 ) ;
      ~title = GetValue ( ~fields ; 2 ) ;
      ~tags = GetValue ( ~fields ; 3 ) ;
      ~project = GetValue ( ~fields ; 4 ) ;
      ~created_by = GetValue ( ~fields ; 5 ) ;

      ~json = JSONSetElement ( "{}" ;
        [ "id" ; ~id ; JSONString ] ;
        [ "title" ; ~title ; JSONString ] ;
        [ "tags" ; ~tags ; JSONString ] ;
        [ "project" ; ~project ; JSONString ] ;
        [ "created_by" ; ~created_by ; JSONString ]
      ) ;

      ~output = JSONSetElement ( ~output ; "[" & ~i & "]" ; ~json ; JSONObject ) ;
      ~i = ~i + 1
    ] ;

    ~output
  )
]

// Optional: Show result
// Show Custom Dialog [ Message: $$noteJson; Default Button: “OK”, Commit: “Yes”; Button 2: “Cancel”, Commit: “No” ]

Set Web Viewer [ Object Name: "webviewer"; Action: Reload ]
This will save the JSON to a global $$notesJson variable that we can merge into the new web viewer for the graph view. Set this script to run On Record Load, so that the graph view can update whenever records are navigated.
Alternatively, you can call the FileMaker Data API in your script to get the JSON, then set the global variable.

Building the graph view with Vis.js
Next, add a new web viewer, and a text object to store the HTML. Link the web viewer to display the text object content like before, using Get(LayoutObjectAttribute). Then enter the following code in the text object:
<!DOCTYPE html>
<html>
<head>
  <meta charset="utf-8" />
  <meta name="viewport" content="width=device-width, initial-scale=1.0">
  <title>Basic VisJS Network Example</title>
  <script src="https://unpkg.com/vis-network@9.1.2/dist/vis-network.min.js"></script>
  <style>
    body {
      font-family: sans-serif;
      margin: 0;
      padding: 20px;
    }

    #network {
      width: 100%;
      height: 600px;
      border: 1px solid #ccc;
    }
  </style>
</head>
<body>
  <div id="network"></div>

  <script>
    // Create mock data directly
    const nodes = new vis.DataSet([
      { id: 1, label: 'Node 1', color: '#4169E1' },
      { id: 2, label: 'Node 2', color: '#B8860B' },
      { id: 3, label: 'Node 3', color: '#3CB371' },
      { id: 4, label: 'Node 4', color: '#C71585' },
      { id: 5, label: 'Node 5', color: '#4169E1' }
    ]);

    const edges = new vis.DataSet([
      { from: 1, to: 3, label: 'connects to' },
      { from: 1, to: 2, label: 'relates to' },
      { from: 2, to: 4, label: 'depends on' },
      { from: 2, to: 5, label: 'references' },
      { from: 3, to: 5, label: 'links to' }
    ]);

    const data = {
      nodes: nodes,
      edges: edges
    };

    const options = {
      nodes: {
        shape: 'dot',
        size: 16,
        font: { size: 14 }
      },
      edges: {
        arrows: 'to',
        font: {
          align: 'middle'
        }
      },
      physics: {
        stabilization: true,
        barnesHut: {
          gravitationalConstant: -8000,
          springLength: 150,
          springConstant: 0.04
        }
      },
      interaction: {
        hover: true,
        tooltipDelay: 200
      }
    };

    const container = document.getElementById('network');
    const network = new vis.Network(container, data, options);

    // Handle window resize
    function resizeNetwork() {
      network.fit();
    }

    // Initial sizing
    resizeNetwork();

    // Add resize event listener
    window.addEventListener('resize', resizeNetwork);
  </script>
</body>
</html>
This should give you a hard-coded graph with a few nodes connected.

Notice how the JSON is structured to feed the graph. The nodes have an id, label and color, and the edges have a to, from, and label. But the data we want to graph is in a different format, with JSON describing each note. We can merge in the notes JSON the same way as before, then map over it with JavaScript to create the nodes and edges data.
Update the web viewer source to merge in the $$notesJson variable:
Substitute (

  GetLayoutObjectAttribute ( "webviewerCode"; "content" );
  "NOTE_JSON";
  $$noteJson

 )
Then update the text object:
<!DOCTYPE html>
<html>
<head>
  <meta charset="utf-8" />
  <meta name="viewport" content="width=device-width, initial-scale=1.0">
  <title>Basic VisJS Network Example</title>
  <script src="https://unpkg.com/vis-network@9.1.2/dist/vis-network.min.js"></script>
  <style>
    body {
      font-family: sans-serif;
    }

    #network {
      width: 100%;
      height: 600px;
      border: 1px solid #ccc;
    }

    .legend {
      position: absolute;
      bottom: 20px;
      right: 20px;
      background-color: rgba(255, 255, 255, 0.8);
      border: 1px solid #ccc;
      border-radius: 5px;
      padding: 10px;
    }

    .legend-title {
      font-weight: bold;
      margin-bottom: 5px;
      border-bottom: 1px solid #ccc;
      padding-bottom: 5px;
    }

    .legend-item {
      display: flex;
      align-items: center;
      margin: 5px 0;
    }

    .legend-color {
      width: 15px;
      height: 15px;
      margin-right: 10px;
      border-radius: 3px;
    }
  </style>
</head>
<body>
  <div id="network"></div>

  <div class="legend">
    <div class="legend-title">Node Types</div>
    <div class="legend-item">
      <div class="legend-color" style="background-color: #B8860B;"></div>
      <div>Captain's Log</div>
    </div>
    <div class="legend-item">
      <div class="legend-color" style="background-color: #4169E1;"></div>
      <div>Captain</div>
    </div>
    <div class="legend-item">
      <div class="legend-color" style="background-color: #3CB371;"></div>
      <div>Project</div>
    </div>
    <div class="legend-item">
      <div class="legend-color" style="background-color: #C71585;"></div>
      <div>Tag</div>
    </div>
  </div>

  <script>
    const sampleLogs = {NOTE_JSON};

    const logs = sampleLogs;
    const nodes = [];
    const edges = [];
    const nodeSet = new Set();

    // Function to handle tags that might be arrays or semicolon-separated strings
    function processTags(tags) {
      if (Array.isArray(tags)) {
        return tags;
      } else if (typeof tags === 'string') {
        return tags.split(';').map(tag => tag.trim()).filter(tag => tag !== '');
      }
      return [];
    }

    logs.forEach((log, i) => {
      // Use log.id if available, otherwise use index
      const logId = `log-${log.id || i}`;

      // Add the log node
      nodes.push({
        id: logId,
        label: log.title,
        shape: 'box',
        group: 'log',
        title: log.title // Tooltip on hover
      });

      // Add captain nodes with prefix to prevent collisions with other node types
      const captainId = `captain-${log.created_by}`;
      if (!nodeSet.has(captainId)) {
        nodes.push({
          id: captainId,
          label: log.created_by,
          group: 'captain',
          title: `Captain: ${log.created_by}`
        });
        nodeSet.add(captainId);
      }
      edges.push({ from: logId, to: captainId, label: 'author' });

      // Add project nodes with prefix
      const projectId = `project-${log.project}`;
      if (!nodeSet.has(projectId)) {
        nodes.push({
          id: projectId,
          label: log.project,
          group: 'project',
          title: `Project: ${log.project}`
        });
        nodeSet.add(projectId);
      }
      edges.push({ from: logId, to: projectId, label: 'project' });

      // Process tags that might be arrays or semicolon-separated strings
      const tagArray = processTags(log.tags);

      tagArray.forEach(tag => {
        // Add tag nodes with prefix
        const tagId = `tag-${tag}`;
        if (!nodeSet.has(tagId)) {
          nodes.push({
            id: tagId,
            label: tag,
            group: 'tag',
            title: `Tag: ${tag}`
          });
          nodeSet.add(tagId);
        }
        edges.push({ from: logId, to: tagId, label: 'tag' });
      });
    });

    const data = {
      nodes: new vis.DataSet(nodes),
      edges: new vis.DataSet(edges)
    };

    const options = {
      nodes: {
        shape: 'dot',
        size: 16,
        font: { size: 14 }
      },
      edges: {
        arrows: 'to',
        font: {
          align: 'middle'
        }
      },
      groups: {
        log: { shape: 'box', color: '#B8860B' },
        captain: { color: '#4169E1' },
        project: { color: '#3CB371' },
        tag: { color: '#C71585' }
      },
      physics: {
        stabilization: true,
        barnesHut: {
          gravitationalConstant: -8000,
          springLength: 150,
          springConstant: 0.04
        }
      },
      interaction: {
        hover: true,
        tooltipDelay: 200
      }
    };

    const container = document.getElementById('network');
    const network = new vis.Network(container, data, options);

    // Handle window resize
    function resizeNetwork() {
      network.fit();
    }

    // Initial sizing
    resizeNetwork();

    // Add resize event listener
    window.addEventListener('resize', resizeNetwork);
  </script>
</body>
</html>
This should give you a network graph based on your actual notes:

There’s a bit of JavaScript involved here, and it will be different depending on your field names and how you want to structure the relationships. Just take a sample of your source JSON and the nodes/edges JSON from the hard-coded example, and ask ChatGPT to write a JavaScript function to create the JSON to feed the graph.
Next, we can add a click event to the notes nodes to navigate to that record in FileMaker:
    // Handle node selection
    network.on("selectNode", function(params) {
      if (params.nodes.length === 1) {
        const nodeId = params.nodes[0];
        const selectedNode = nodes.find(node => node.id === nodeId);

        if (selectedNode && selectedNode.group === 'log') {
          // For log nodes, extract the log ID from the node ID
          const logIdMatch = nodeId.match(/log-(\d+)/);
          if (logIdMatch && logIdMatch[1]) {
            const logId = logIdMatch[1];


            // Call FileMaker script with the log ID
            FileMaker.PerformScript("Select Record", logId);
          }
        }
      }
    });
And add a Select Record script to call when clicking a note:
Set Variable [ $id; Value:Get(ScriptParameter) ]
Perform Find [ Specified Find Requests: Find Records; Criteria: notes::id: “$id” ]
Now select a note and you should see FileMaker navigate to that record.
Here’s the final HTML with some extra CSS to add a gradient and some stars to the background:

<!DOCTYPE html>
<html>
<head>
  <meta charset="utf-8" />
  <meta name="viewport" content="width=device-width, initial-scale=1.0">
  <title>Star Trek Captains' Logs Graph</title>
  <script src="https://unpkg.com/vis-network@9.1.2/dist/vis-network.min.js"></script>
  <style>
    html, body {
      margin: 0;
      padding: 0;
      height: 100%;
      width: 100%;
      font-family: sans-serif;
      background-color: #050811;
      color: #e1e6f0;
      overflow: hidden;
      position: fixed;
    }

    #network {
      width: 100%;
      height: 100vh;
      border: 1px solid #212941;
      position: relative;
      z-index: 10;
      overflow: hidden;
    }

    /* Space background with stars and galaxies */
    body::before {
      content: "";
      position: fixed;
      top: 0;
      left: 0;
      width: 100%;
      height: 100%;
      background-image:
        radial-gradient(circle at 20% 35%, rgba(81, 56, 157, 0.15) 0%, transparent 50%),
        radial-gradient(circle at 75% 44%, rgba(124, 85, 214, 0.1) 0%, transparent 40%),
        radial-gradient(circle at 30% 70%, rgba(29, 78, 216, 0.15) 0%, transparent 45%),
        radial-gradient(circle at 50% 80%, rgba(49, 78, 204, 0.1) 0%, transparent 30%);
      z-index: 1;
    }

    /* Star layers with different animations */
    .stars {
      position: fixed;
      top: 0;
      left: 0;
      width: 100%;
      height: 100%;
      pointer-events: none;
      z-index: 5;
    }

    .stars-small {
      background-image:
        radial-gradient(1px 1px at 5% 10%, rgba(255, 255, 255, 0.9) 0%, transparent 100%),
        radial-gradient(1px 1px at 15% 25%, rgba(255, 255, 255, 0.8) 0%, transparent 100%),
        radial-gradient(1px 1px at 30% 65%, rgba(255, 255, 255, 0.7) 0%, transparent 100%),
        radial-gradient(1px 1px at 37% 22%, rgba(255, 255, 255, 0.8) 0%, transparent 100%),
        radial-gradient(1px 1px at 55% 30%, rgba(255, 255, 255, 0.9) 0%, transparent 100%),
        radial-gradient(1px 1px at 75% 55%, rgba(255, 255, 255, 0.8) 0%, transparent 100%),
        radial-gradient(1px 1px at 82% 3%, rgba(255, 255, 255, 0.7) 0%, transparent 100%),
        radial-gradient(1px 1px at 85% 85%, rgba(255, 255, 255, 0.8) 0%, transparent 100%),
        radial-gradient(1px 1px at 95% 45%, rgba(255, 255, 255, 0.7) 0%, transparent 100%),
        radial-gradient(1px 1px at 42% 79%, rgba(255, 255, 255, 0.8) 0%, transparent 100%),
        radial-gradient(1px 1px at 23% 53%, rgba(255, 255, 255, 0.7) 0%, transparent 100%),
        radial-gradient(1px 1px at 63% 76%, rgba(255, 255, 255, 0.9) 0%, transparent 100%),
        radial-gradient(1px 1px at 68% 58%, rgba(255, 255, 255, 0.8) 0%, transparent 100%),
        radial-gradient(1px 1px at 74% 92%, rgba(255, 255, 255, 0.7) 0%, transparent 100%),
        radial-gradient(1px 1px at 19% 38%, rgba(255, 255, 255, 0.9) 0%, transparent 100%),
        radial-gradient(1px 1px at 26% 89%, rgba(255, 255, 255, 0.8) 0%, transparent 100%),
        radial-gradient(1px 1px at 8% 76%, rgba(255, 255, 255, 0.7) 0%, transparent 100%);
      animation: stars-move-1 150s linear infinite;
    }

    .stars-medium {
      background-image:
        radial-gradient(1.5px 1.5px at 12% 15%, rgba(255, 255, 255, 0.9) 0%, transparent 100%),
        radial-gradient(1.5px 1.5px at 27% 38%, rgba(255, 255, 255, 0.8) 0%, transparent 100%),
        radial-gradient(1.5px 1.5px at 43% 59%, rgba(255, 255, 255, 0.7) 0%, transparent 100%),
        radial-gradient(1.5px 1.5px at 48% 42%, rgba(255, 255, 255, 0.9) 0%, transparent 100%),
        radial-gradient(1.5px 1.5px at 58% 12%, rgba(255, 255, 255, 0.8) 0%, transparent 100%),
        radial-gradient(1.5px 1.5px at 73% 25%, rgba(255, 255, 255, 0.7) 0%, transparent 100%),
        radial-gradient(1.5px 1.5px at 88% 54%, rgba(255, 255, 255, 0.9) 0%, transparent 100%),
        radial-gradient(1.5px 1.5px at 94% 77%, rgba(255, 255, 255, 0.8) 0%, transparent 100%),
        radial-gradient(1.5px 1.5px at 83% 93%, rgba(255, 255, 255, 0.7) 0%, transparent 100%),
        radial-gradient(1.5px 1.5px at 32% 82%, rgba(255, 255, 255, 0.8) 0%, transparent 100%),
        radial-gradient(1.5px 1.5px at 17% 67%, rgba(255, 255, 255, 0.7) 0%, transparent 100%),
        radial-gradient(1.5px 1.5px at 71% 33%, rgba(255, 255, 255, 0.8) 0%, transparent 100%),
        radial-gradient(1.5px 1.5px at 63% 64%, rgba(255, 255, 255, 0.9) 0%, transparent 100%);
      animation: stars-move-2 120s linear infinite;
    }

    .stars-large {
      background-image:
        radial-gradient(2px 2px at 20% 30%, rgba(255, 255, 255, 0.9) 0%, transparent 100%),
        radial-gradient(2px 2px at 40% 70%, rgba(255, 255, 255, 0.8) 0%, transparent 100%),
        radial-gradient(2px 2px at 60% 20%, rgba(255, 255, 255, 0.7) 0%, transparent 100%),
        radial-gradient(2px 2px at 70% 90%, rgba(255, 255, 255, 0.9) 0%, transparent 100%),
        radial-gradient(2px 2px at 90% 40%, rgba(255, 255, 255, 0.8) 0%, transparent 100%),
        radial-gradient(2px 2px at 10% 60%, rgba(255, 255, 255, 0.8) 0%, transparent 100%),
        radial-gradient(2px 2px at 30% 95%, rgba(255, 255, 255, 0.9) 0%, transparent 100%),
        radial-gradient(2px 2px at 85% 15%, rgba(255, 255, 255, 0.8) 0%, transparent 100%),
        radial-gradient(2px 2px at 55% 55%, rgba(255, 255, 255, 0.7) 0%, transparent 100%);
      animation: stars-move-3 80s linear infinite;
    }

    /* Bright "twinkle" stars */
    .stars-twinkle {
      background-image:
        radial-gradient(2.5px 2.5px at 15% 23%, rgba(255, 255, 255, 0.9) 0%, transparent 100%),
        radial-gradient(2.5px 2.5px at 36% 45%, rgba(255, 255, 255, 0.8) 0%, transparent 100%),
        radial-gradient(2.5px 2.5px at 58% 16%, rgba(255, 255, 255, 0.7) 0%, transparent 100%),
        radial-gradient(2.5px 2.5px at 76% 62%, rgba(255, 255, 255, 0.9) 0%, transparent 100%),
        radial-gradient(2.5px 2.5px at 33% 86%, rgba(255, 255, 255, 0.8) 0%, transparent 100%),
        radial-gradient(2.5px 2.5px at 88% 33%, rgba(255, 255, 255, 0.7) 0%, transparent 100%);
      animation: stars-twinkle 10s ease-in-out infinite;
    }

    /* Colorful distant stars */
    .stars-color {
      background-image:
        radial-gradient(2px 2px at 25% 40%, rgba(255, 204, 204, 0.8) 0%, transparent 100%),
        radial-gradient(2px 2px at 45% 20%, rgba(204, 204, 255, 0.8) 0%, transparent 100%),
        radial-gradient(2px 2px at 65% 45%, rgba(204, 255, 204, 0.7) 0%, transparent 100%),
        radial-gradient(2px 2px at 85% 75%, rgba(255, 255, 204, 0.8) 0%, transparent 100%),
        radial-gradient(2px 2px at 22% 75%, rgba(255, 204, 255, 0.7) 0%, transparent 100%);
      animation: stars-move-4 180s linear infinite;
    }

    @keyframes stars-move-1 {
      0% { background-position: 0% 0%; }
      100% { background-position: 100% 100%; }
    }

    @keyframes stars-move-2 {
      0% { background-position: 100% 0%; }
      100% { background-position: 0% 100%; }
    }

    @keyframes stars-move-3 {
      0% { background-position: 50% 0%; }
      100% { background-position: 50% 100%; }
    }

    @keyframes stars-move-4 {
      0% { background-position: 0% 50%; }
      100% { background-position: 100% 50%; }
    }

    @keyframes stars-twinkle {
      0%, 100% { opacity: 0.2; }
      50% { opacity: 0.9; }
    }

    /* Legend styles */
    .legend {
      position: absolute;
      bottom: 20px;
      right: 20px;
      background-color: rgba(10, 14, 23, 0.8);
      border: 1px solid #212941;
      border-radius: 5px;
      padding: 10px;
      color: white;
      z-index: 100;
      box-shadow: 0 0 10px rgba(0, 0, 0, 0.5);
    }

    .legend-title {
      font-weight: bold;
      margin-bottom: 5px;
      border-bottom: 1px solid #3A4366;
      padding-bottom: 5px;
    }

    .legend-item {
      display: flex;
      align-items: center;
      margin: 5px 0;
    }

    .legend-color {
      width: 15px;
      height: 15px;
      margin-right: 10px;
      border-radius: 3px;
    }
  </style>
</head>
<body>
  <div id="network"></div>

  <!-- Star layers -->
  <div class="stars stars-small"></div>
  <div class="stars stars-medium"></div>
  <div class="stars stars-large"></div>
  <div class="stars stars-twinkle"></div>
  <div class="stars stars-color"></div>

  <div class="legend">
    <div class="legend-title">Node Types</div>
    <div class="legend-item">
      <div class="legend-color" style="background-color: #B8860B;"></div>
      <div>Captain's Log</div>
    </div>
    <div class="legend-item">
      <div class="legend-color" style="background-color: #4169E1;"></div>
      <div>Captain</div>
    </div>
    <div class="legend-item">
      <div class="legend-color" style="background-color: #3CB371;"></div>
      <div>Project</div>
    </div>
    <div class="legend-item">
      <div class="legend-color" style="background-color: #C71585;"></div>
      <div>Tag</div>
    </div>
  </div>
  <script>
    // Get input data from FileMaker or use sample data
    let logs = NOTE_JSON;

    // Handle FileMaker data if available
    try {
      // FileMaker WebViewer will set this variable
      if (typeof FileMakerData !== 'undefined' && FileMakerData) {
        logs = JSON.parse(FileMakerData);
        console.log("Using FileMaker data:", logs);
      }
    } catch (e) {
      console.error("Error parsing FileMaker JSON data:", e);
      alert("Error parsing data from FileMaker: " + e.message);
    }

    const nodes = [];
    const edges = [];
    const nodeSet = new Set();

    // Function to handle tags that might be arrays or semicolon-separated strings
    function processTags(tags) {
      if (Array.isArray(tags)) {
        return tags;
      } else if (typeof tags === 'string') {
        return tags.split(';').map(tag => tag.trim()).filter(tag => tag !== '');
      }
      return [];
    }

    logs.forEach((log, i) => {
      // Use log.id if available, otherwise use index
      const logId = `log-${log.id || i}`;

      // Add the log node
      nodes.push({
        id: logId,
        label: log.title,
        shape: 'box',
        group: 'log',
        title: log.title // Tooltip on hover
      });

      // Add captain nodes with prefix to prevent collisions with other node types
      const captainId = `captain-${log.created_by}`;
      if (!nodeSet.has(captainId)) {
        nodes.push({
          id: captainId,
          label: log.created_by,
          group: 'captain',
          title: `Captain: ${log.created_by}`
        });
        nodeSet.add(captainId);
      }
      edges.push({ from: logId, to: captainId, label: 'author' });

      // Add project nodes with prefix
      const projectId = `project-${log.project}`;
      if (!nodeSet.has(projectId)) {
        nodes.push({
          id: projectId,
          label: log.project,
          group: 'project',
          title: `Project: ${log.project}`
        });
        nodeSet.add(projectId);
      }
      edges.push({ from: logId, to: projectId, label: 'project' });

      // Process tags that might be arrays or semicolon-separated strings
      const tagArray = processTags(log.tags);

      tagArray.forEach(tag => {
        // Add tag nodes with prefix
        const tagId = `tag-${tag}`;
        if (!nodeSet.has(tagId)) {
          nodes.push({
            id: tagId,
            label: tag,
            group: 'tag',
            title: `Tag: ${tag}`
          });
          nodeSet.add(tagId);
        }
        edges.push({ from: logId, to: tagId, label: 'tag' });
      });
    });

    const data = {
      nodes: new vis.DataSet(nodes),
      edges: new vis.DataSet(edges)
    };

    const options = {
      nodes: {
        shape: 'dot',
        size: 16,
        font: { size: 14, color: '#FFFFFF' }
      },
      edges: {
        arrows: 'to',
        font: {
          align: 'middle',
          color: '#FFFFFF',
          strokeWidth: 0,
          background: {
            enabled: true,
            color: 'rgba(10, 14, 23, 0.7)',
            size: 5
          }
        },
        color: { color: '#3A4366', hover: '#5A6386' }
      },
      groups: {
        log: { shape: 'box', color: '#B8860B', font: { color: '#FFFFFF' } },
        captain: { color: '#4169E1', font: { color: '#FFFFFF' } },
        project: { color: '#3CB371', font: { color: '#FFFFFF' } },
        tag: { color: '#C71585', font: { color: '#FFFFFF' } }
      },
      physics: {
        stabilization: true,
        barnesHut: {
          gravitationalConstant: -8000,
          springLength: 150,
          springConstant: 0.04
        }
      },
      interaction: {
        hover: true,
        tooltipDelay: 200
      }
    };

    const container = document.getElementById('network');
    const network = new vis.Network(container, data, options);

    // Handle window resize
    function resizeNetwork() {
      network.setSize('100%', window.innerHeight + 'px');
      network.fit({
        animation: {
          duration: 500,
          easingFunction: 'easeInOutQuad'
        }
      });
    }

    // Initial sizing
    resizeNetwork();

    // Add resize event listener
    window.addEventListener('resize', resizeNetwork);

    // Handle node selection
    network.on("selectNode", function(params) {
      if (params.nodes.length === 1) {
        const nodeId = params.nodes[0];
        const selectedNode = nodes.find(node => node.id === nodeId);

        if (selectedNode && selectedNode.group === 'log') {
          // For log nodes, extract the log ID from the node ID
          const logIdMatch = nodeId.match(/log-(\d+)/);
          if (logIdMatch && logIdMatch[1]) {
            const logId = logIdMatch[1];


            // Call FileMaker script with the log ID
            FileMaker.PerformScript("Select Record", logId);
          }
        }
      }
    });
  </script>
</body>
</html>
This should give you a good starting point for building your own network graph and markdown editor. From here you can update the logic based on your fields and create edges (relationships) using backlinks, like in Obsidian, or create a knowledge graph using NER (named-entity recognition).
Conclusion
Web viewers in FileMaker Pro are a great way to extend the platform and add new features like a Markdown editor and network graph. Like all the other apps in my FileMaker-Experiments repository, this app is meant to be a proof-of-concept and a starting point, not a complete app. There’s a lot more you could do from here, like outputting the Markdown to PDF, sending it as an email, or adding hover effects and popups to the network graph. Feel free to copy the app and modify for your own use case.